Surface roughness is a critical yet often overlooked aspect of mechanical design and manufacturing. While engineers and designers may focus on material composition, strength, and dimensional tolerances, the microscopic peaks and valleys that make up a surface’s texture can significantly impact a component’s performance, durability, and functionality. From reducing friction in moving parts to ensuring proper adhesion of coatings, understanding and controlling surface roughness is essential across numerous industries.
This comprehensive guide explores what surface roughness is, how it’s measured, the standards that govern it, and why it matters for your applications.
What is Surface Roughness?
Surface roughness refers to the small, finely spaced deviations from the nominal surface that form the texture of a material. These deviations appear as microscopic peaks and valleys across a surface. When viewed in cross-section, these irregularities create a profile that can be measured and quantified.
While surfaces may appear smooth to the naked eye, even polished glass or touchscreens have a controlled level of roughness when examined at the microscopic level. This roughness is typically measured in micrometers (μm), which are 0.001mm, or microinches (μin), which are 0.000001 inches.
Common Surface Roughness Terminology
- Profile: A cross-sectional outline of a surface used for measurement
- Mean line: The reference line from which deviations are measured
- Peaks: Portions of the profile that extend above the mean line
- Valleys: Portions of the profile that extend below the mean line
- Sampling length: The length over which a single roughness measurement is evaluated
- Evaluation length: The total length over which multiple sampling lengths are measured
- Primary profile (P): The complete surface profile before filtering
- Roughness profile (R): The profile after filtering out waviness
- Waviness profile (W): The medium-scale deviations of a surface
Surface Roughness Parameters
Surface roughness is quantified through various parameters, each providing different insights into a surface’s characteristics. The most common parameters include:
1. Amplitude Parameters
| Parameter | Description | Formula | Applications |
|---|---|---|---|
| Ra (Arithmetic Mean Roughness) | The arithmetic average of absolute values of profile height deviations from the mean line | Ra = (1/L)∫|Z(x)|dx | General purpose, widely used across industries |
| Rq (Root Mean Square) | The root mean square of profile height deviations (more sensitive to peaks and valleys than Ra) | Rq = √[(1/L)∫Z²(x)dx] | Optical surfaces, statistical analysis |
| Rz (Maximum Height) | The average of the five highest peaks and five lowest valleys within the sampling length | Rz = (Rp1+Rp2+…+Rp5+Rv1+Rv2+…+Rv5)/5 | Sealing surfaces, gaskets |
| Rt (Total Height) | The total height from the highest peak to the lowest valley within the evaluation length | Rt = Rp + Rv | Critical surfaces where defects are unacceptable |
| Rsk (Skewness) | Measures the symmetry of the profile about the mean line | Rsk = (1/Rq³)[(1/L)∫Z³(x)dx] | Bearing surfaces, friction analysis |
| Rku (Kurtosis) | Measures the sharpness of the profile | Rku = (1/Rq⁴)[(1/L)∫Z⁴(x)dx] | Contact analysis, wear prediction |
Spacing and Hybrid Parameters
- RSm (Mean Width): Average spacing between profile peaks
- Rdq (Root Mean Square Slope): Average slope of the profile
- Rmr (Material Ratio): Percentage of material at a specific depth
Note: While Ra is the most commonly used parameter, it doesn’t provide a complete picture of a surface. Two surfaces with identical Ra values can have very different functional properties. For critical applications, multiple parameters should be evaluated.
Why Surface Roughness Matters
Surface roughness significantly impacts a component’s performance, durability, and functionality across various applications. Understanding these effects is crucial for proper design and manufacturing decisions.
Mechanical Performance
- Affects friction between moving parts
- Influences wear resistance and component lifespan
- Impacts fatigue strength and stress distribution
- Determines load-bearing capacity of surfaces
Surface Interactions
- Controls adhesion of coatings and paints
- Affects sealing capabilities of gaskets
- Influences fluid flow characteristics
- Determines optical properties like reflection
Manufacturing Quality
- Indicates proper machining and finishing
- Affects assembly precision and fit
- Impacts cleanliness and contamination control
- Determines aesthetic appearance
Industry-Specific Importance
Aerospace
In aerospace applications, precise surface roughness is critical for aerodynamic performance, fuel efficiency, and component fatigue life. Turbine blades, for example, require extremely smooth surfaces to maximize airflow efficiency and minimize drag.
Automotive
Engine components like cylinder bores require specific roughness profiles to retain oil while minimizing friction. Bearing surfaces need precise roughness to maintain proper lubrication films and reduce wear.
Medical Devices
For medical implants, surface roughness can determine biocompatibility and osseointegration (bone integration). Dental implants often have controlled roughness to promote bone attachment, while heart valves require ultra-smooth surfaces to prevent blood clotting.
Electronics
In semiconductor manufacturing, surface roughness affects electrical conductivity, heat dissipation, and bonding reliability. Circuit boards require controlled roughness for proper adhesion of conductive layers.
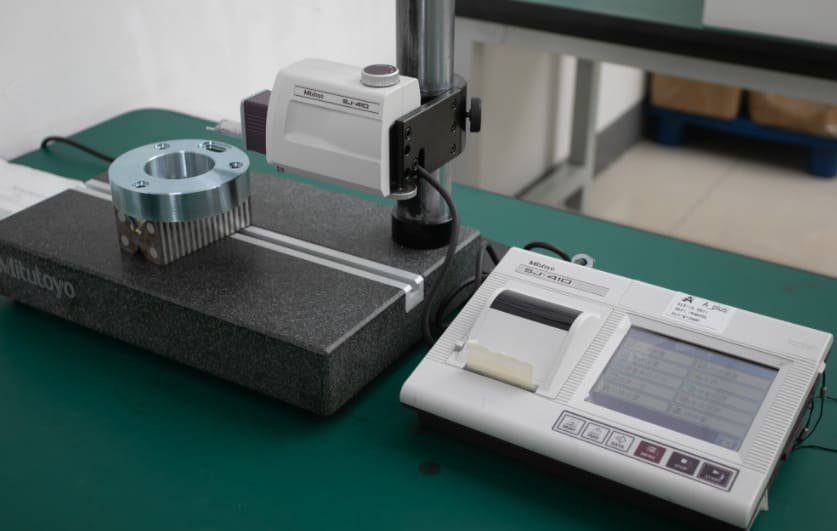
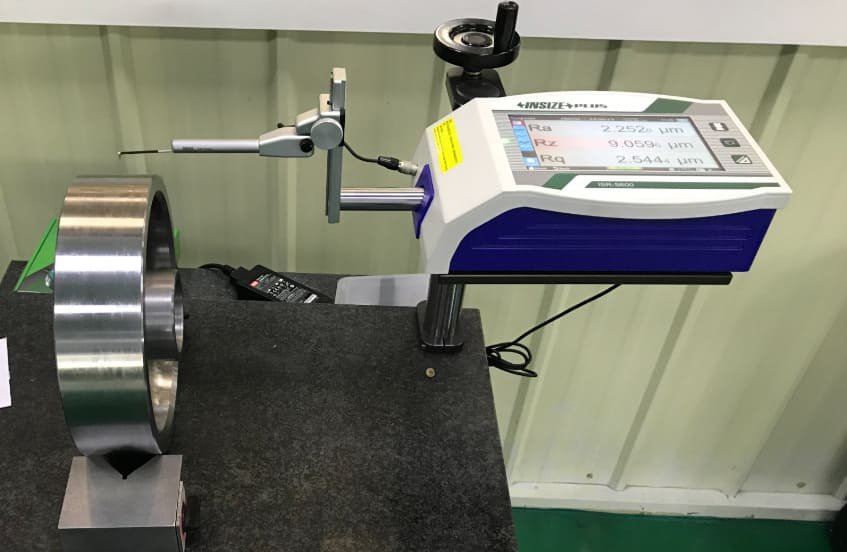
Surface Roughness Measurement Methods
Several methods are available, each with distinct advantages and limitations.
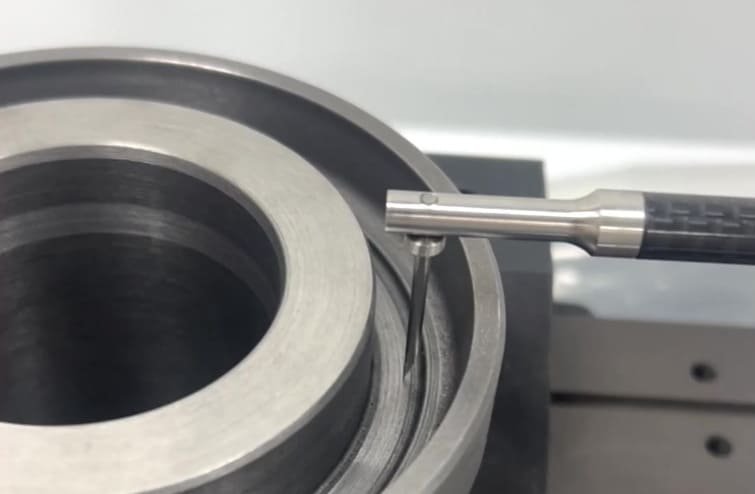
1. Stylus Profilometry
The most traditional and widely used method involves a diamond stylus that physically traces across the surface. As the stylus moves, its vertical displacement is recorded to create a profile of the surface.
Advantages:
- High accuracy and repeatability
- Direct measurement of surface profile
- Well-established standards and procedures
- Works on most materials regardless of optical properties
Limitations:
- Can potentially scratch delicate surfaces
- Stylus tip radius limits resolution of fine features
- Relatively slow measurement process
- Limited to accessible surfaces
2. Optical Profilometry
Uses light instead of physical contact to measure surface topography. Common techniques include focus variation, confocal microscopy, and interferometry.
Advantages:
- Non-destructive measurement
- Rapid data acquisition
- Can measure delicate surfaces
- Provides 3D surface maps
Limitations:
- Affected by surface optical properties
- Limited on highly reflective or transparent surfaces
- Higher equipment cost
3. Atomic Force Microscopy (AFM)
Uses a cantilever with a sharp tip to scan the surface. The tip’s deflection is measured to create a high-resolution topographic map of the surface.
Advantages:
- Extremely high resolution (nanometer scale)
- Can measure atomic-level features
- Works on most materials
Limitations:
- Very small measurement area
- Slow measurement process
- Expensive equipment
- Requires specialized training
Surface Roughness Standards and Units
Surface roughness measurements are governed by international standards that ensure consistency and comparability across different industries and regions. These standards define measurement procedures, parameters, and notation methods.
Key International Standards
- ISO 4287: Defines profile method terms, definitions, and parameters (Ra, Rz, etc.)
- ISO 4288: Specifies rules and procedures for surface roughness assessment
- ISO 25178: Covers areal (3D) surface texture parameters and measurement methods
- ASME B46.1: American standard for surface texture measurement and specification
- JIS B 0601: Japanese industrial standard for surface roughness
Measurement Units
Surface roughness is typically measured in:
- Micrometers (μm): 1 μm = 0.001 mm (metric system, used globally)
- Microinches (μin): 1 μin = 0.000001 inch (imperial system, common in the US)
Conversion: 1 μm = 39.37 μin
Examples of Surface Roughness Symbols
| Symbol | Interpretation |
|---|---|
| ∇ 3.2 | Surface may be non-machined; maximum Ra = 3.2 μm. |
| ∇̲ 1.6 | Surface must be machined; maximum Ra = 1.6 μm. |
| ∇̲₀.₈⁶.₃ | Machined surface; Ra must be between 0.8 μm (lower limit) and 6.3 μm (upper limit). |
| ∇̲ 3.2 | Machined surface with Ra = 3.2 μm; lay parallel to the view. |
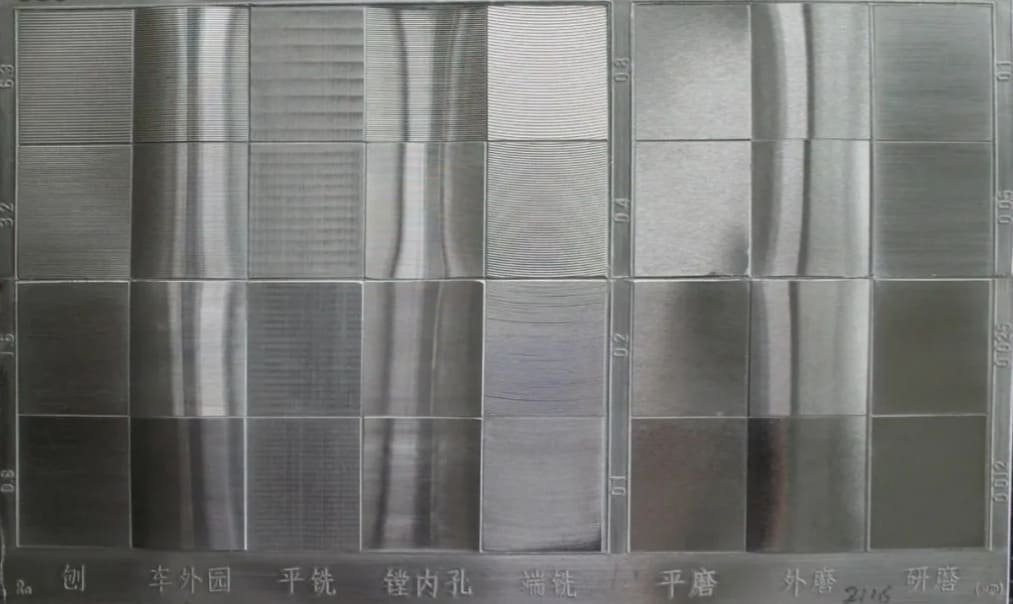
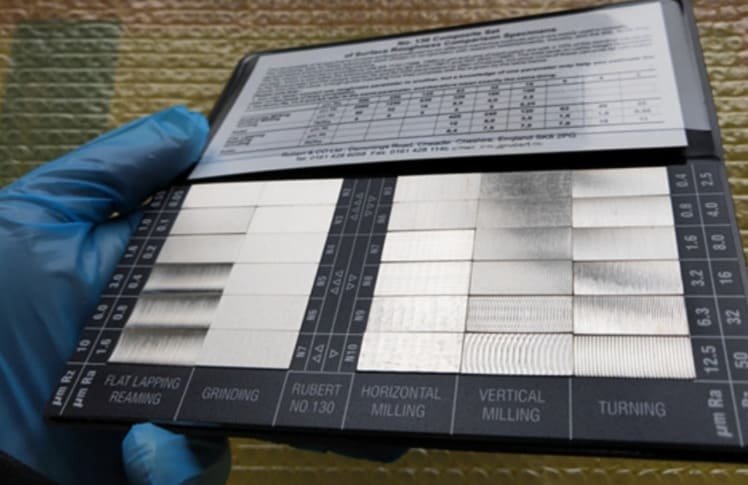
Factors Affecting Surface Roughness
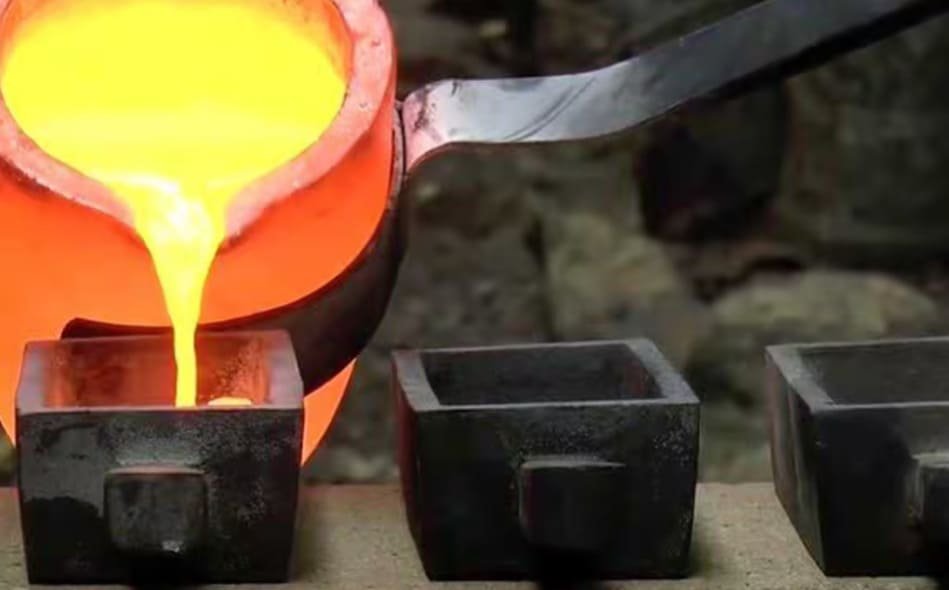
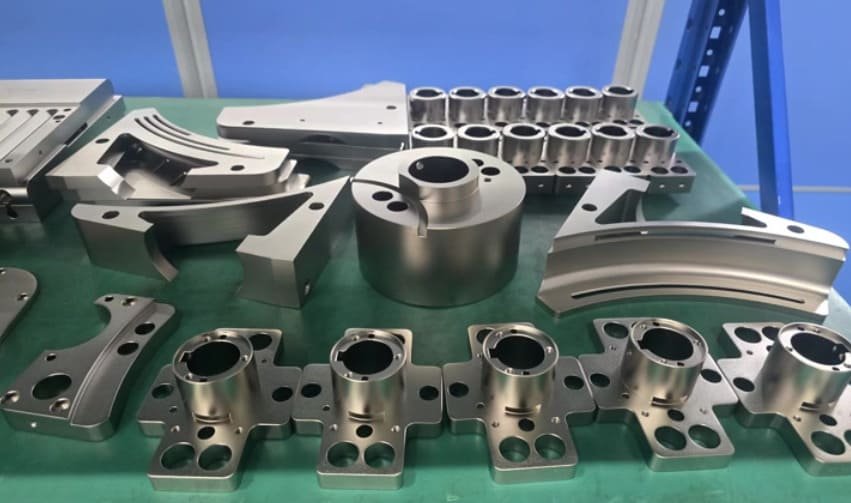
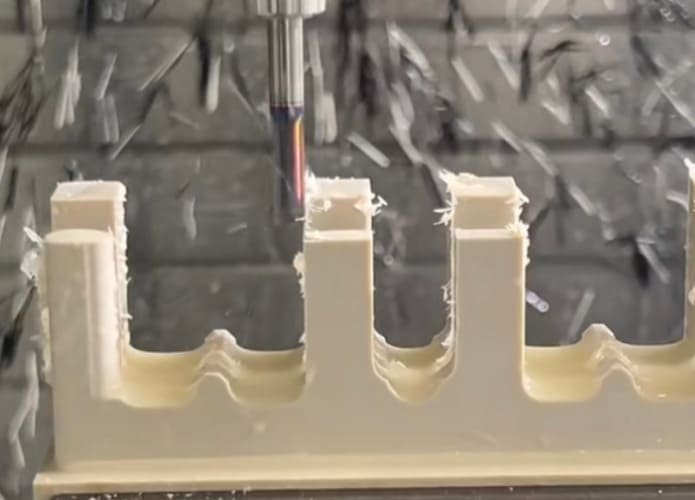
1. Manufacturing Processes
| Process | Typical Ra Range (μm) | Surface Pattern | Applications |
|---|---|---|---|
| Sand Casting | 12.5 – 25.0 | Random, coarse | Rough components before machining |
| Milling | 1.6 – 6.3 | Directional, tool marks | General machining, structural parts |
| Turning | 0.8 – 3.2 | Circular, feed marks | Shafts, cylindrical components |
| Grinding | 0.1 – 1.6 | Linear, fine | Precision components, bearing surfaces |
| Lapping | 0.05 – 0.4 | Random, very fine | Sealing surfaces, gauge blocks |
| Polishing | 0.025 – 0.2 | Random, extremely fine | Optical components, molds |
2. Tool Characteristics
- Tool geometry and sharpness
- Tool material and coating
- Tool wear condition
- Cutting edge radius
3. Process Parameters
- Cutting speed and feed rate
- Depth of cut
- Coolant type and application
- Machine rigidity and vibration
4. Material Properties
- Hardness and ductility
- Grain structure and size
- Homogeneity
- Thermal properties
Applications and Optimal Roughness Levels
Different applications require specific surface roughness levels to achieve optimal performance. Here are some examples of recommended roughness values for various applications:
| Application | Typical Ra Range (μm) | Critical Parameters | Reason for Requirement |
|---|---|---|---|
| Bearing Surfaces | 0.1 – 0.8 | Ra, Rsk, Rku | Optimize lubrication, reduce friction and wear |
| Cylinder Bores | 0.4 – 0.8 | Ra, Rz, Rpk, Rvk | Oil retention while minimizing friction |
| Sealing Surfaces | 0.8 – 1.6 | Ra, Rz, Rt | Prevent leakage while ensuring proper contact |
| Dental Implants | 1.0 – 2.0 | Sa, Sdr | Promote osseointegration with bone tissue |
| Optical Surfaces | 0.005 – 0.05 | Rq, Rt | Minimize light scattering and distortion |
| Aerospace Turbine Blades | 0.2 – 0.8 | Ra, Rz, RSm | Optimize airflow, reduce drag and turbulence |
| Printed Circuit Boards | 1.0 – 3.0 | Ra, Rz | Ensure proper adhesion of conductive layers |
| Gear Teeth | 0.4 – 1.6 | Ra, Rz, RSm | Reduce noise, improve load distribution |
Case Studies: Surface Roughness Optimization
Automotive Engine Components
A major automotive manufacturer reduced engine friction by 15% by optimizing cylinder bore surface roughness. By creating a plateau honing pattern with controlled Rpk and Rvk values, they achieved both good oil retention in the valleys and minimal friction at the peaks. This resulted in improved fuel efficiency and extended engine life.
Medical Implant Surfaces
Researchers developed an optimized surface roughness profile for titanium dental implants that increased bone integration by over 30%. By creating a micro-roughened surface with an Ra of 1.5 μm and specific 3D texture characteristics, they significantly improved implant stability and reduced healing time for patients.
FAQs About Surface Roughness
How does surface roughness affect friction?
Surface roughness has a complex relationship with friction. Contrary to intuition, extremely smooth surfaces can sometimes have higher friction due to adhesion forces and reduced lubrication retention.
What’s the difference between Ra and Rq?
Ra (Arithmetic Mean Roughness) and Rq (Root Mean Square Roughness) are both amplitude parameters that measure surface height variations, but they calculate them differently:
- Ra is the arithmetic average of absolute height deviations from the mean line
- Rq is the root mean square average of height deviations (squares values before averaging)
Key differences:
- Rq is more sensitive to peaks and valleys than Ra
- Rq is always larger than or equal to Ra for the same surface
- Rq has better statistical significance as it represents the standard deviation of the height distribution
- Ra is more commonly used in general engineering, while Rq is often preferred for optical surfaces
How do I convert between micrometers (μm) and microinches (μin)?
To convert between micrometers and microinches, use these formulas:
- To convert from micrometers to microinches: μin = μm × 39.37
- To convert from microinches to micrometers: μm = μin ÷ 39.37
Common conversions:
- 0.8 μm = 32 μin
- 1.6 μm = 63 μin
- 3.2 μm = 125 μin
In technical drawings, you might see both units listed, with one in parentheses, such as “0.8 μm (32 μin)”.
Conclusion
Surface roughness is a critical aspect of component design and manufacturing that significantly impacts performance, durability, and functionality. By understanding the parameters, measurement methods, and factors affecting surface roughness, engineers and manufacturers can make informed decisions to optimize surfaces for specific applications.
Remember that surface roughness specification should always balance functional requirements with manufacturing capabilities and costs. Over-specifying can lead to unnecessary expenses, while under-specifying may result in performance issues or premature failure.